By: Zubeyde Oysul, Senior Policy Analyst for the Center for Critical Minerals Strategy, SAFE
The U.S. Geological Survey (USGS) and the U.S. Department of the Interior (DOI) unveiled the 2025 List of Critical Minerals, an expanded catalog now covering 60 minerals deemed essential to U.S. economic and national security. With the last list released in 2022, the update was highly anticipated. Unlike the separate critical or strategic materials lists maintained by the U.S. Department of Energy and the Defense Logistics Agency, the USGS list is developed through an interagency process and is widely viewed by industry as the closest thing to a whole-of-government benchmark for identifying and addressing mineral supply risks. As such, inclusion on the list is often coveted by both producers and consumers seeking recognition of market or supply-chain vulnerabilities—and the policy attention that can follow.
Figure 1. The Periodic Table of Critical Minerals, 2018-2025
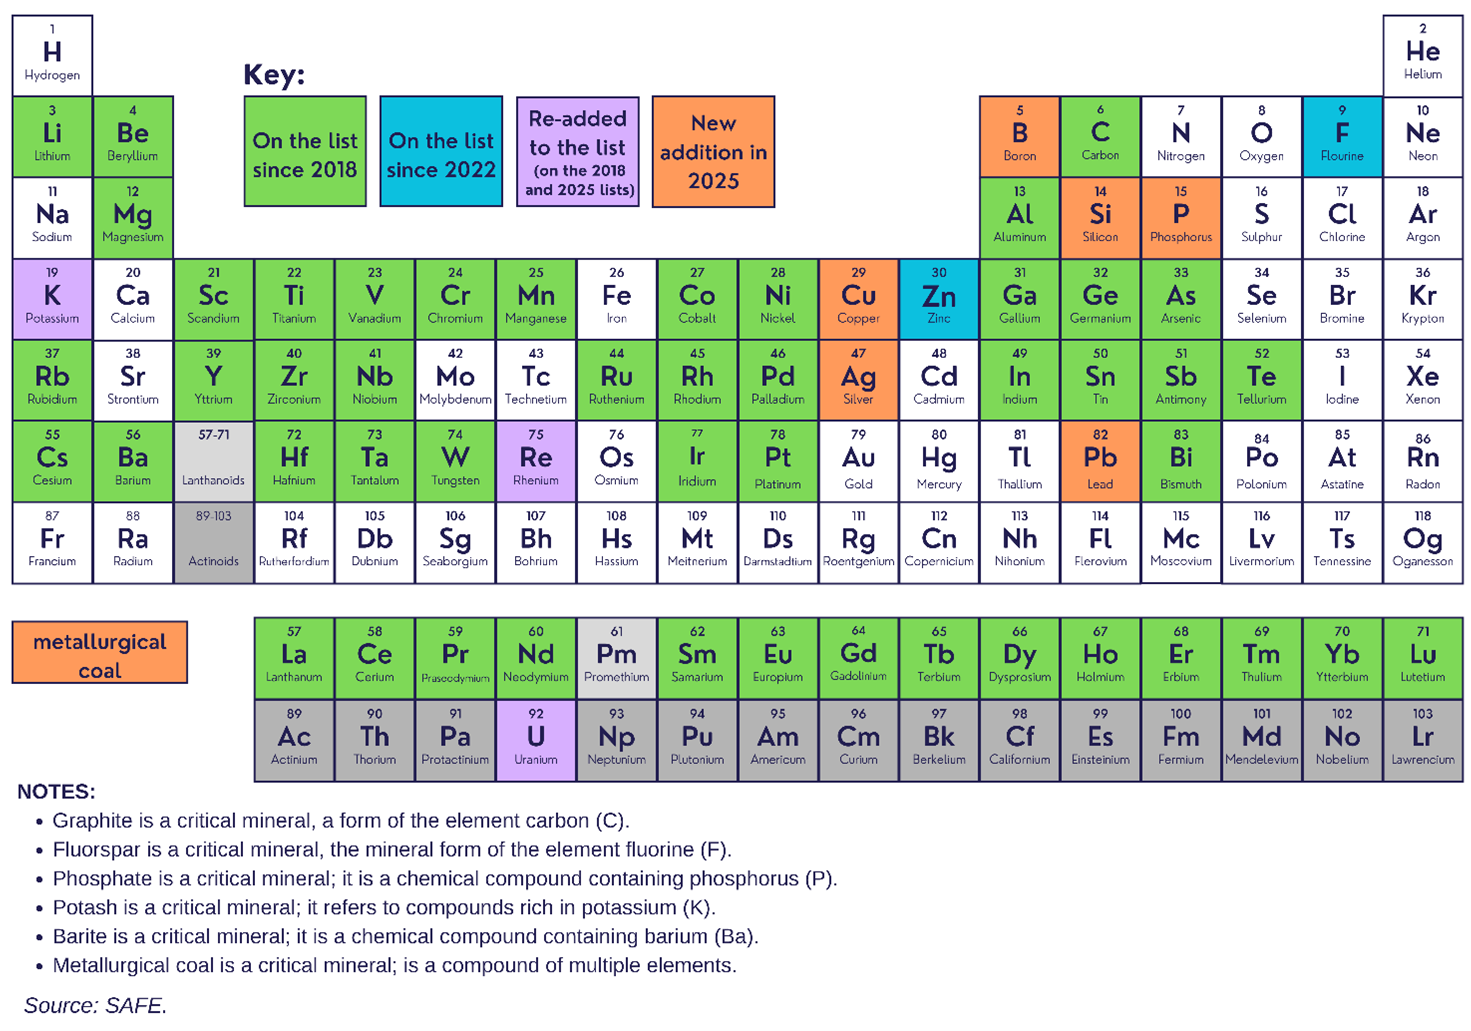
Still, 60 is a big number. While part of that reflects the U.S. practice of listing rare earth elements and platinum group metals individually, it is a reminder that Washington cannot address every critical mineral supply chain vulnerability at once. Prioritization matters, and the updated USGS methodology offers a window into one of the key considerations shaping how policymakers assess risk and determine which supply chains warrant the most attention.
How does DOI determine criticality?
To qualify as a critical mineral, a material must meet two core criteria set by Congress. First, its supply chain must be vulnerable to disruption. Second, it must serve an essential function in the manufacturing of products vital to the U.S. economy or national security. The USGS spearheads the initial assessment by developing a methodology. While each update introduces refinements to how criticality is measured, the 2025 update marks a leap forward. It models the economic consequences of potential trade disruptions for each mineral by simulating the loss of supply from every producing country individually. This level of modeling complexity, made possible by advances in machine learning, shows how technological innovation is unlocking new possibilities for data-driven policymaking.
Several key variables are built into the economic assessment model in addition to the production and trade data. First, contributions from both primary production (mined material) and secondary production (recycling and recovery from scrap) are taken into account when data is available. Second, the USGS accounts for excess production capacity in the United States and other countries that could help offset potential shortages both domestically and globally. Third, the model projects how demand and supply would adjust in response to changing prices. These variables determine the new market price and supply level for each disruption scenario, which the USGS then uses to model the broader economic ripple effects. The analysis captures impacts on both domestic consumers and producers of mineral commodities: consumers face reduced output and higher input costs if the rest of the world cannot compensate for the disruption, while producers gain from higher prices and the opportunity to expand output.
The USGS modelled 1,200 distinct disruption scenarios for 84 mineral commodities (31 of these reflect different production stages or forms of 11 mineral commodity supply chains), and more than 400 industries. Recognizing that not all disruption scenarios are equally likely to occur, the USGS assigns probabilities to each scenario based on country- and commodity-specific factors, including prior trade barriers imposed, economic reliance on mineral exports, political stability, and economic or military aggression on the assumption that economies more dependent on exports are less likely to impose restrictions. It does not consider how these countries may treat the United States versus other trading partners. It also does not take into account restrictions the United States may impose on importing or coursing materials from these countries.
Table 1. Estimated Probability of Supply Disruption by Country
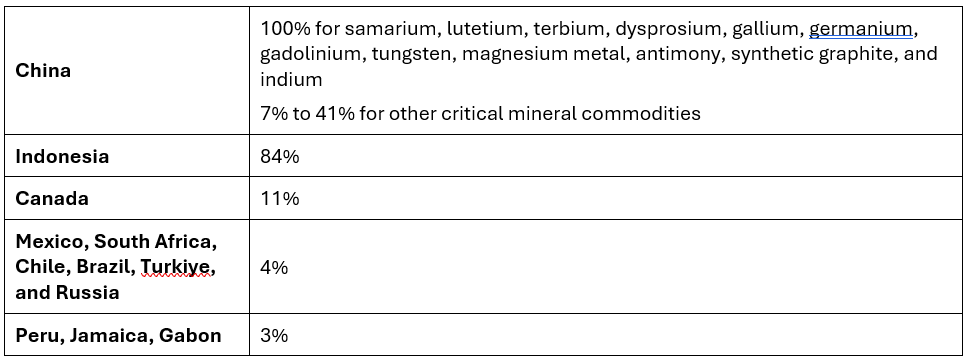
The final results reflect both the economic importance of each mineral and the likelihood of a disruption, so the size of the quantified economic risk is not solely determined by the probability of supply disruption. In some cases, the probability-weighted net GDP loss is relatively high even when the likelihood of supply disruption is low because the consequences of losing access to imported material would be severe. Potash illustrates this dynamic: Even though almost all of potash imports come from Canada, a stable supplier, it is one of the 12 critical minerals with the highest economic risks. A similar pattern is true for niobium (Brazil), aluminum (Canada), copper (Chile), and platinum (South Africa), which have relatively higher economic risks despite the low probability of supply disruption. Conversely, tungsten shows the opposite pattern. The overall economic impact of a supply disruption is relatively smaller, but the higher probability of supply disruption places it at a higher risk level.
Mineral commodities with a probability-weighted net GDP loss greater than $2 million are considered “critical.” For mineral commodities that do meet this threshold or lack sufficient data for a quantitative evaluation, USGS checks to see if there is a single point of failure at any stage of the supply chain. Minerals without sufficient market data can also be added to the list based on a qualitative assessment of their importance to U.S. national and economic security.
Economic Modelling Supports Prioritization
The criticality assessment provides quantitative evidence for well-recognized dynamics. While global supply disruptions have a negative impact on the U.S. economy in most cases, for eight mineral commodities where we are net exporters, supply disruptions above have a net positive impact (gold, molybdenum, silicon metal, helium, iron ore, and mined zinc, copper, and nickel). China continues to be the primary contributor to net GDP loss for 32 of the 50 critical minerals added to the list based on economic impacts modelling.
But more importantly, the update to the methodology allows the USGS to quantify the level of threat to the U.S. economy, an important metric to help prioritize action since the criticality assessment cast a wide net for inclusion. Minerals are ranked by the size of their modeled economic impacts and grouped into five risk categories: high, elevated, moderate, limited, and negligible. Those in the top three categories are included on the critical minerals list, while minerals with limited or negligible risk are recommended for exclusion.
The tiered approach is a major improvement, giving policymakers and industry a clearer view of where risks to the U.S. economy are most acute and insight into how to calibrate policy responses that are proportionate to each mineral’s risk profile.
Figure 2. Critical Minerals Divided by Risk Categories
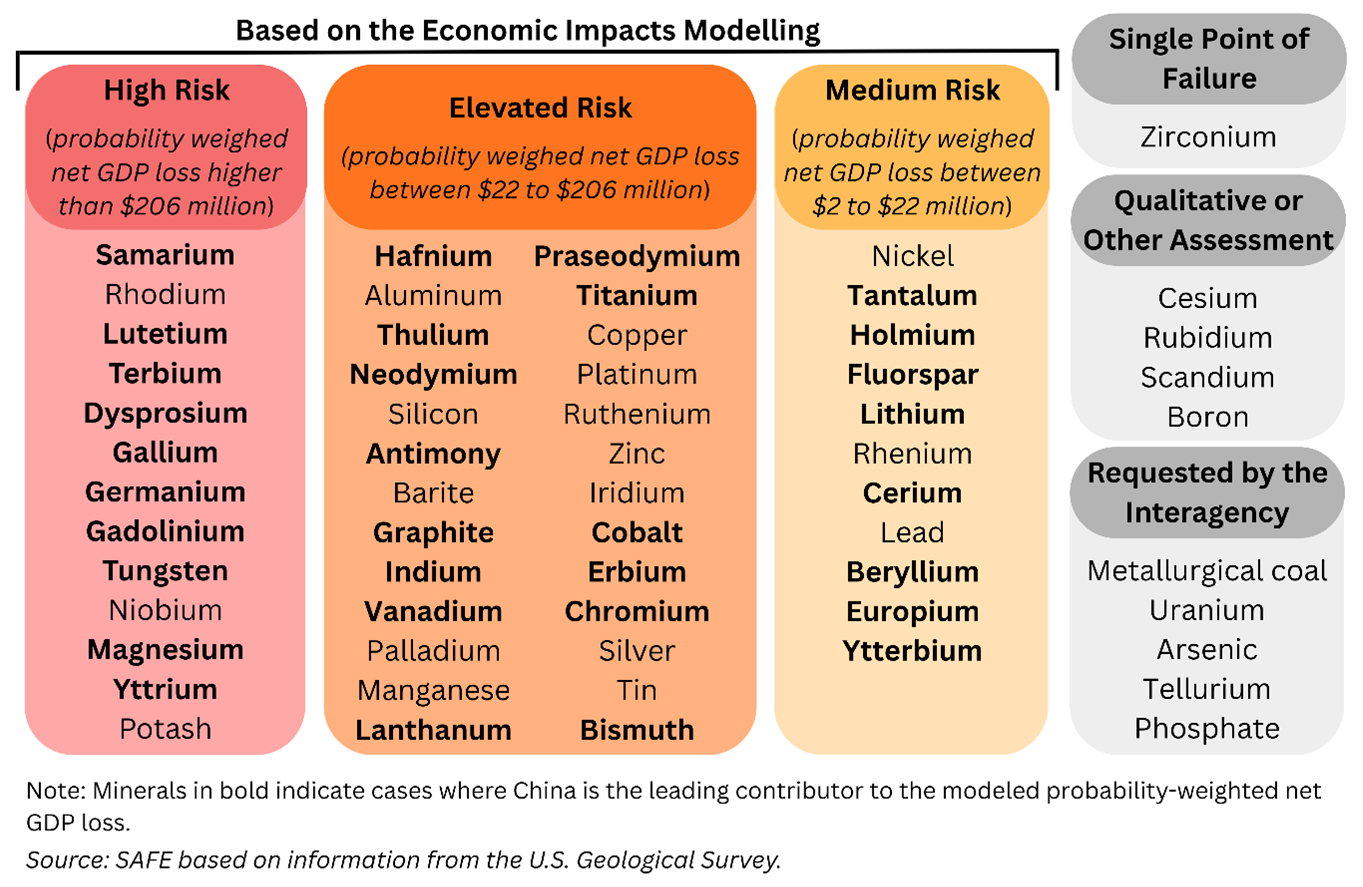
Rather than continually expanding the critical minerals list, SAFE has long recommended creating a separate “threatened” category to distinguish between minerals facing the most immediate supply risks and those that are less vulnerable today but could become critical over time. The USGS’s adoption of risk-based groupings achieves a similar goal, providing clearer differentiation even in the absence of a fully forward-looking assessment.
The Methodology Has Notable Limitations
Retrospective
As mentioned above, the USGS criticality assessment remains a snapshot in time. The analysis relies on the most recently available data (largely 2024 for mineral production capacity and 2023 for consuming industries), which may already lag the fast-changing market realities of today. This is likely why the Department of the Interior announced that the list would be reviewed more dynamically: updated at least once every two years.
A forward-looking assessment is still not in the books. The USGS published its first World Minerals Outlook earlier this year, demonstrating that it can project changes in global supply within a five-year horizon with a reasonable degree of certainty. However, the criticality assessment uses robust economic modeling to quantify domestic demand and impacts to downstream manufacturing sectors. Any forecast related to consumption would be inherently more uncertain and likely less reliable than supply forecasts, particularly given the uncertainties surrounding the pace of reindustrialization, the rise of artificial intelligence, increased digitization, and the deployment of advanced energy and transportation technologies.
Lack of Data
Another recommendation SAFE has long made is improving the granularity of the assessment, which is key to identifying specific points along the supply chain where vulnerabilities are greatest, assessing risks to the U.S. economy and national security based on those chokepoints, and helping guide government attention to parts of the supply chain where risks are most acute. The 2025 update continues to make progress in this direction. It included more detailed assessments for eleven supply chains—aluminum, chromium, cobalt, copper, graphite, fluorspar, manganese, nickel, silicon, titanium, and zinc. Other mineral commodities like tungsten, however, are examined only at the mining stage. Improving the availability of underlying data will be essential to extend this more nuanced approach to a wider range of minerals.
The case of boron provides another illustration of how data gaps impact the USGS assessment. Lacking sufficient data, especially on ferroboron production, USGS couldn’t model its supply chain risk, and boron was left off the draft list in August. After feedback received during the public comment period, USGS decided to use other steel alloys that have a similar level of Chinese market control as a proxy to assess economic risks for ferroboron. This adjustment led to boron’s inclusion on the final list, but without better data on ferroboron production and trade, it will remain difficult to gauge the true level of risk and guide appropriate policy responses.
Assessments Are Done at the Commodity Level
The USGS’s criticality assessment does not capture vulnerabilities in specialized applications further downstream. For example, gallium is assessed at low-purity refinery output. Supply chain vulnerabilities for the further refined forms of gallium arsenide (GaAs) and gallium nitride (GaN) used in semiconductors and defense electronics are not considered. Tellurium is evaluated at the refinery production stage, but does not assess the production of ultra-high-purity tellurium or cadmium telluride (CdTe) used in solar PV cells and other advanced electronics. These later stages may also represent critical chokepoints that remain invisible in the current approach.
A separate but related question arises with the case of phosphate, which is added to the critical minerals list at the request of the U.S. Department of Agriculture due to its importance for food security. Phosphate has other applications, including as an input for lithium iron phosphate (LFP) batteries, though in a different chemical form. It remains unclear whether or not the interagency will take non-agriculture applications into account when developing strategies to secure phosphate supplies.
The above examples underscore the importance of interagency coordination and alignment with other U.S. government lists better suited to capture risks of disruptions in producing specialized grades of material required for different applications, such as the Department of Energy’s (DOE) Critical Materials list and the Defense Logistics Agency’s (DLA) Critical and Strategic Materials List.
National and Energy Security Considerations Are Not Modelled
The USGS methodology does not capture broader national security consequences that risk understating, and when used on its own, the economic impact modelling risks understating true national security vulnerabilities. It is important to complement the economic impact modelling with assessments that account for defense, energy security, and geopolitical factors.
National and energy security considerations are already shaping which minerals are considered critical. The inclusion of arsenic and tellurium on the final list, added at the request of the Pentagon, reflects an acknowledgment that certain materials can have outsized strategic importance even when their modeled economic risk is limited. Similarly, DOE recommended adding metallurgical coal and uranium to the list, citing their critical roles in steel production, energy generation, and defense applications.
Moving forward, these broader considerations should guide not only how minerals are prioritized but also the scale and type of government intervention deemed appropriate. For instance, the probability-weighted GDP loss is estimated at only $201 million for aluminum and $56 million for refined copper. The capital investment required to expand domestic smelting capacity can reach $4 billion per million metric tons for aluminum and $1–3 billion for copper projects outside China. From a purely economic perspective, the scale of public investment that may be needed to catalyze multi-billion-dollar projects appears disproportionate to the modeled losses. From a national security standpoint, however, the strategic importance of these materials for advanced defense systems and critical infrastructure can justify total government support on a much greater scale.